Taking On Support
By David Smetters, CEO @ Respondus
Several years back when my colleague Ray Henderson was president at Blackboard, he would present a “Report Card” at the annual user conference that graded the company’s progress on product and support.
The “Support” portion of the Report Card was the most interesting because it included year-over-year data on outstanding defects, response times, customer satisfaction ratings, and the like.
This got me thinking about our own support at Respondus. And the truth was, we weren’t doing much performance measurement back then. In fact, it took nearly half a year to gather data and to establish a baseline for improvement.
The first thing that became apparent – and it wasn’t a surprise – is that applications used by instructors (rather than students) require very little support. This includes products like Respondus 4, StudyMate Author, and the Test Bank Network, which are only used by teachers. So even though these applications are licensed across 1,000+ universities and K-12 institutions, the total number of instructors using them is less than 100,000.
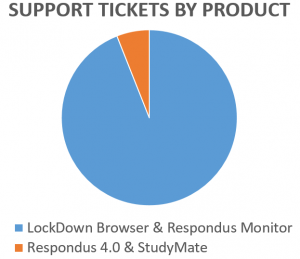
That’s small potatoes compared to LockDown Browser and Respondus Monitor, which are installed on millions of computers and tablets. Students take over 30 million assessments annually with these applications, so it’s little surprise they were accounting for 94% of our support tickets.
Improving Support Metrics
So we decided to focus our efforts on LockDown Browser and Respondus Monitor, the latter of which is an extension of the LockDown Browser technology. We began by capturing basic data from support tickets, such as the OS being used, the LMS for the institution, type of problem, resolution, etc. Each week we analyzed the average response time for tickets, how many responses were required to close tickets, how long tickets remained open, and the customer satisfaction ratings of closed tickets. It became a bit of an obsession for us.
The data drove improvements on multiple fronts, leading to the addition of staff, extended support hours, an overhaul to the knowledge base, and a reworking of the escalation process. More importantly, we used the data to prioritize enhancements for the products themselves (discussed further below).
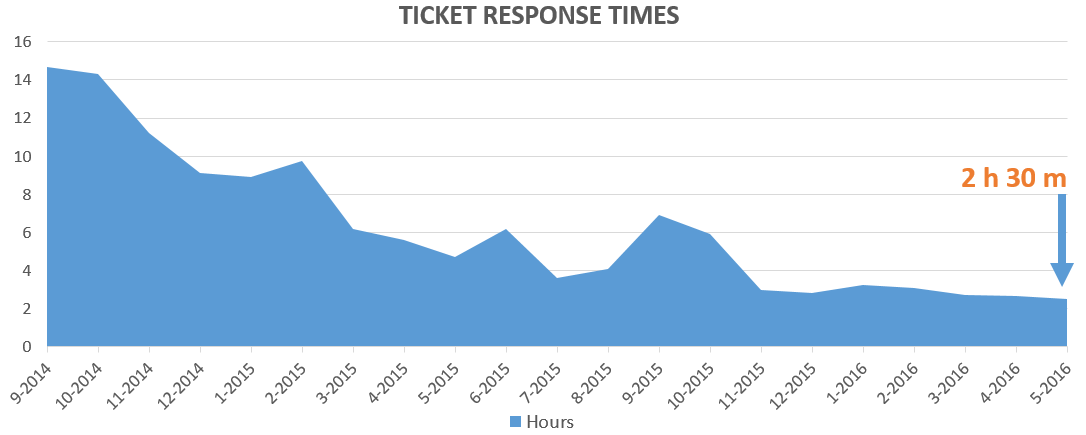
The weekly metrics began to show positive results. For example, the response time for support tickets fell from an average of 14 hours in early 2014, to around 2.5 hours in in early 2016. The median time was about 90 minutes.
During this same stretch, the average time to fully resolve and close a ticket fell from 7.2 days to about 2.3 days. Again, the median time was even lower.
The most satisfying metric has been with the customer satisfaction surveys that occur after a support ticket is closed. On a 5-point scale, the average rating during the period August 2015 through May 2016 was 4.8.

Product Enhancements
On a separate track, we wanted to improve the product using data gathered by our support team.
The most significant outcome was the introduction of a new browser engine for the Windows version of LockDown Browser. In mid-2015 we switched from Internet Explorer to Google’s Chromium browser engine (more on that here). Not only did this eliminate many issues that were out of our control (corrupted installations of IE, malware infections, etc.), but it gave us access to the source code so issues could be addressed directly. This change alone resulted in a huge drop in support tickets, despite a period of rapid growth for LockDown Browser and Respondus Monitor.
As of this writing, we are preparing a Chromium release for the Mac version of LockDown Browser, which will eliminate our reliance on Safari WebKit.
Student Feedback
While it might sound like our primary goal was to reduce the number of support tickets we received, this wasn’t the case. In fact, as the number of support tickets declined, we began to feel a disconnect with actual users of our applications: students.
This is a classic problem with student-oriented software. Technical problems get filtered through technologists or teachers at an institution. If the institution solves the problem before it gets back to the vendor, improvements are less likely to occur for that issue.
So our next step was to create a way for student issues to bubble up to us, as well as to provide a way for students to be able to solve their own problems.
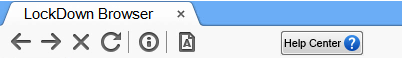 First, we added a “Help Center” button to the toolbar of LockDown Browser that lets students run a system check on their computer, networking environment, and the LMS itself. The data is presented in a simple format that allows users to solve basic problems, such as a computer with poor Internet connectivity.
Next, we made it easy for students to send this technical information to their institution’s help desk, or to open a ticket directly with Respondus. The effort to troubleshoot an issue is hugely simplified if the System Check information is provided at the start of a support ticket. Indeed, this is probably the greatest contributing factor reducing the time it takes to resolve a support ticket.
Finally, we added a student-centric knowledge base within the LockDown Browser and Respondus Monitor applications themselves. This lets students solve problems on their own, while still providing us data on which KB articles are being accessed most often.
We don’t plan to issue an annual report card on our support services. But we’ve received great feedback from clients about how these efforts have reduced support issues directed to their own help desks. We expect this trend to continue as we roll out further enhancements to the user experience for LockDown Browser and Respondus Monitor.
And the timing couldn’t be better. Many institutions are seeing triple-digit, annual growth in the use of LockDown Browser and Respondus Monitor across campus. A reduction in support issues makes everyone happy.